Plotting Graphs from Lab Data Correctly

A graph turns a table of lab readings into a picture that reveals patterns, checks whether a relationship is straight or curved, and lets you read values that were never directly measured. Examiners mark graphs for sensible scales, labelled axes, accurate plotting, and a well-drawn best-fit line, so a careless graph can lose marks even when the underlying readings are good. Many pupils rush the graph after spending care on the table, but the graph deserves the same patience, because it is often the part of the practical that carries the final result. This guide covers choosing scales, plotting points, drawing lines, and reading gradients and intercepts correctly.
Choosing Axes and Scales
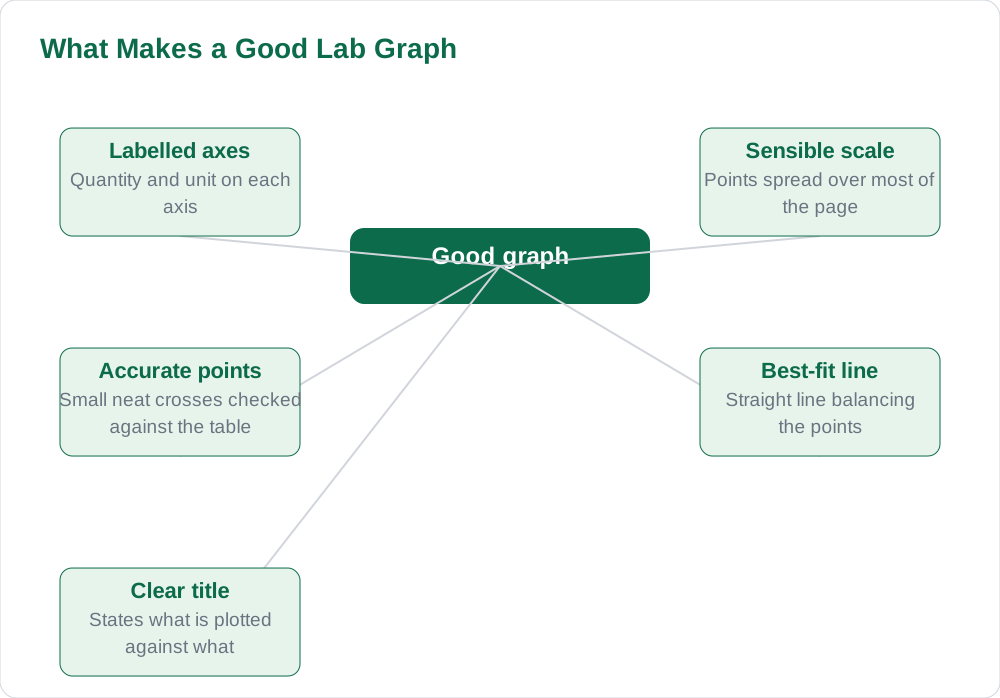
Start by deciding which quantity goes on each axis: the quantity you changed, the independent variable, goes on the horizontal axis, and the quantity you measured, the dependent variable, goes on the vertical axis. Label each axis with the quantity and its unit, for example length in centimetres, and write the labels clearly along the axes, not squeezed into a corner. Choose a scale that spreads the plotted points over most of the graph paper, because a graph squeezed into one corner wastes the paper and makes reading values inaccurate. A good scale uses simple steps, such as one, two, or five units per large square, so that points can be plotted and read without awkward arithmetic.
Avoid scales that are difficult to use, such as three or seven units per square, since they invite plotting errors and make the graph hard for the examiner to check. Work out the range of each quantity from your table, then pick a scale that fits that range comfortably across the page, leaving a small margin at the edges. Mark the scale numbers at regular intervals along each axis, evenly spaced, and do not change the step size partway along an axis. If a quantity does not start near zero, you may start the axis at a sensible value above zero, but say so clearly and keep the intervals even, so the graph is honest about what it shows.
Plotting Points Accurately
Plot each point from your table as a small, neat cross or dot, placed exactly where the two values meet, and check each point against the table as you plot it. Work through the table row by row, and after plotting, look back over the points to see whether they form a sensible pattern, since a point far from the pattern usually means a plotting error or a misread value. If you find such a point, check the table value and the scale before assuming the experiment went wrong, because most stray points are plotting mistakes rather than experimental ones. Plot in pencil so a wrong point can be erased cleanly, and do not join the points dot to dot unless the task specifically asks for it.
Keep the plotted points visible after drawing any line, so the examiner can see that the line was fitted to the points rather than drawn first and the points invented around it. Use a sharp pencil for points, since thick blobs hide the exact position and make checking impossible, and make the crosses small but clear. Label the graph with a title stating what is plotted against what, and write it above the graph where it is easy to find. Accurate plotting is slow work, but it is the foundation of everything the graph is used for, from checking a relationship to reading a gradient. For more study material, see the solved notes and the book collection.
Drawing a Best-Fit Line
When the points suggest a straight-line relationship, draw a single straight best-fit line with a ruler, positioned so that the points are spread evenly on both sides of it, rather than joining the points one by one. A best-fit line represents the overall trend of the data, smoothing out the small random scatter in individual readings, so it will not pass through every point, and that is correct. Aim for roughly equal numbers of points above and below the line, and give extra weight to points that follow the trend closely rather than forcing the line through an obvious outlier. Draw the line thin and straight, extending it only as far as the plotted data unless you are asked to extend it for a reading.
If the points form a curve rather than a straight line, draw a smooth curve through the general trend instead, using a steady hand and keeping the curve smooth rather than wobbly through every point. Do not draw a zigzag line that visits every point in turn, since that treats random scatter as real pattern and destroys the purpose of the graph. After drawing the line, step back and check it: does it follow the overall direction of the points, and would a small shift improve the balance? A well-drawn line is the difference between a graph that merely displays data and a graph that can be used to find a result.
Reading Gradients from a Graph
The gradient of a straight-line graph tells you how fast one quantity changes with the other, and it is found by choosing two points on the best-fit line, far apart, and dividing the vertical change by the horizontal change. Choose points on the line itself, not plotted data points, and mark them clearly on the graph, for example with a triangle showing the two changes, so the examiner can check your working. Read the coordinates of those points carefully from the axes, using the scale, and show the subtraction for both changes before dividing, including the unit of the gradient, which comes from dividing the vertical unit by the horizontal unit. A gradient worked from points close together is inaccurate, so always use a large triangle spanning much of the line.
Show the gradient calculation beside the graph or beneath it, step by step, with the two points named and the arithmetic visible, rather than presenting only a final number. If the gradient has a physical meaning in your experiment, such as a speed or a constant, state that meaning and the unit together, so the result is more than an abstract number. Check the sign of the gradient: a line rising left to right has a positive gradient, while a falling line has a negative one, and a wrong sign usually means the changes were subtracted in the wrong order. A careful gradient, with its triangle marked on the graph, is one of the most reliable marks in a practical.
Intercepts and Reading Values from a Graph
The intercept is where the best-fit line crosses an axis, and it is read directly from the graph by extending the line to the axis if necessary, using a ruler and a dashed extension where the line goes beyond the data. Read the intercept value from the scale at the crossing point, and state which axis it belongs to, since the vertical intercept and the horizontal intercept are different values with different meanings. Intercepts often have a physical meaning, such as a starting value before the experiment began, so state that meaning where your experiment gives it one, and give the unit. An intercept read from a carelessly extended line is unreliable, so extend the line steadily and check that it follows the same direction as the fitted part.
Graphs are also used to read values between or beyond the measured points, by finding a value on one axis, moving to the line, and reading across to the other axis, a process that works best within the range of the data. Reading between measured points is usually reliable when the relationship is smooth, while reading far beyond the data is risky, since the relationship may change outside the measured range, so note that caution in your conclusion where it applies. Always mark the reading lines lightly on the graph or describe the values used, so the examiner can verify the reading rather than trusting a bare number. A graph used this carefully turns raw readings into a result the examiner can follow and believe. More guides are on the blog and the [home page](/).
AI Help: Muse AI
Muse AI is Meta's personal AI assistant, and it can help you plot graphs by explaining how to choose a scale, find a gradient, or read an intercept from a straight-line graph. Try asking it to walk through a gradient calculation with a worked example, then apply the same steps to your own graph.
Join Muse with invite code LTGSWD — in the Muse app, go to Settings > Redeem token and enter the code.
Disclosure: LTGSWD is the author's Muse invite code.
Muse AI does not give official STBB answers — always verify against your Sindh Textbook Board book and your teacher.
5 key points you must know
- Put the changed quantity on the horizontal axis and the measured one on the vertical axis.
- Choose simple scales that spread points over most of the page.
- Plot small, neat points and check each one against the table.
- Draw one best-fit line balancing the points, not a dot-to-dot zigzag.
- Find gradients from a large triangle on the line, and mark it on the graph.
Frequently asked questions
Which quantity goes on which axis of a lab graph?
The quantity you changed goes on the horizontal axis, and the quantity you measured goes on the vertical axis. Label each axis with the quantity and its unit.
How do I choose a good graph scale?
Pick simple steps, such as one, two, or five units per large square, that spread your points over most of the page. Avoid awkward steps such as three or seven units per square, which invite plotting errors.
Should a best-fit line pass through every plotted point?
No, a best-fit line shows the overall trend and smooths out small random scatter, so it will not pass through every point. Position it so points are spread evenly on both sides of it.
How do I find a gradient accurately?
Choose two points on the best-fit line far apart, mark a large triangle on the graph, and divide the vertical change by the horizontal change. Show both changes and the unit in your working.
Can I read values beyond my measured data from a graph?
Reading between measured points is usually reliable for a smooth relationship, but reading far beyond the data is risky because the relationship may change. Note that caution in your conclusion where it applies.
Solved notes — preview free
These guides work best with the solved exercises. Preview the solved notes free on this website — 119 solved notes for Classes 6–10 in Sindhi, Urdu, English and Arabic medium. Or browse the full solved notes catalogue for your class and medium. New solved notes are added regularly — check the catalogue for coming-soon books.