Class 6 Averages: Mean, Median and Mode
An average is a single number that represents a whole set of numbers, and Class 6 teaches three kinds: mean, median and mode. The mean is the total shared equally, the median is the middle value when the numbers are in order, and the mode is the value that appears most often. Each kind is useful in a different situation: the mean describes test scores, the median describes heights when one pupil is much taller than the rest, and the mode describes the most popular shoe size. This guide works through all three with marks and heights, shows how to use tables, and explains which average to choose. More Class 6 maths is in the [book collection](/books.html) and the [solved notes](/solved.html).
The Mean: Sharing the Total Equally
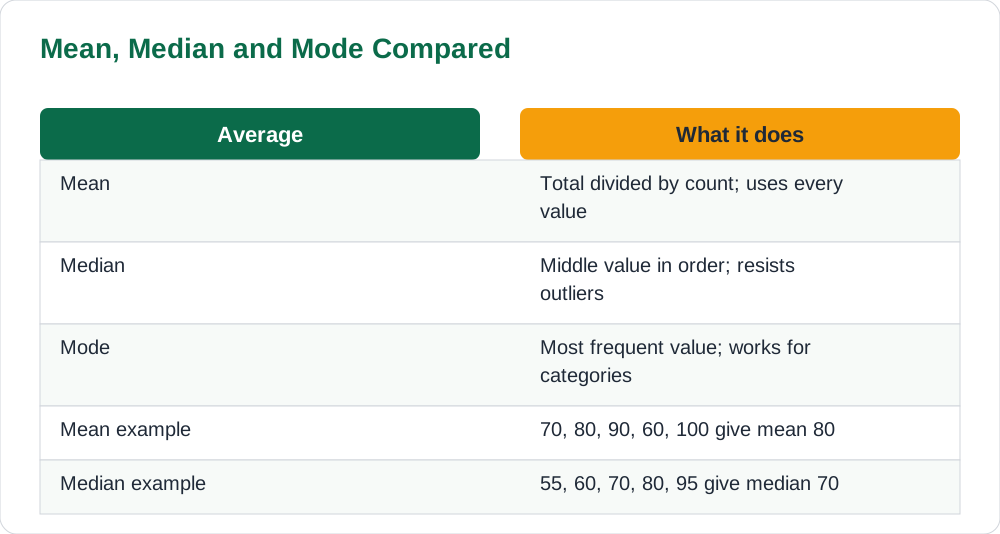
The mean is found by adding all the values and dividing by how many values there are, which is exactly like sharing a total equally. Five test scores of 70, 80, 90, 60 and 100 add to 400, because 70 plus 80 is 150, plus 90 is 240, plus 60 is 300, plus 100 is 400, and dividing 400 by 5 gives a mean of 80. The mean of 80 means that if all five pupils had scored equally, each would have scored 80, even though their real scores ranged from 60 to 100. The mean uses every value in the set, which is its strength and its weakness: one very high or very low value pulls the mean towards itself, so the mean of 10, 10, 10 and 90 is 30, which describes nobody in the group well.
Tables make mean calculations tidy, especially when values repeat. Suppose five pupils have heights of 120 cm, 130 cm, 140 cm, 150 cm and 160 cm: the total is 120 plus 130 plus 140 plus 150 plus 160, which is 700, and dividing by 5 gives a mean height of 140 cm. With a frequency table, multiply each value by how many times it appears, add those products, and divide by the total count: if the score 70 appears twice and 80 appears three times, the total is 2 times 70 plus 3 times 80, which is 140 plus 240, giving 380, and dividing by 5 pupils gives a mean of 76. Always check that your mean lies between the smallest and largest values: a mean outside that range is certainly wrong. Find more guides on the blog.
The Median: The Middle Value
The median is the middle value when the numbers are arranged in order, smallest to largest, and ordering first is essential. The scores 55, 60, 70, 80 and 95 are already in order, and the middle value, with two values on each side, is 70, so the median is 70. The same set in a different order, 95, 55, 80, 70, 60, has the same median, because ordering it gives the same middle value. When there is an even number of values, there is no single middle value, so the median is the mean of the two middle values: for 60, 70, 80 and 90, the two middle values are 70 and 80, and their mean is 75, so the median is 75. Pupils who forget to order first, or who pick the middle of an unordered list, get the median wrong most of the time.
The median is the best average when an extreme value would distort the mean, which happens often with money and heights. The incomes 1,000, 1,200, 1,300, 1,500 and 20,000 have a mean of 5,000, because the total is 25,000 divided by 5, but the median is 1,300, which describes the typical income far better. Similarly, if one pupil in a class is much taller than the rest, the median height stays typical while the mean is pulled up. The median ignores the actual size of extreme values and cares only about their position in the order, which is why it stays steady when an outlier changes. When a question asks for a typical value and the data contains an outlier, choose the median and say why.
The Mode: The Most Frequent Value
The mode is the value that appears most often in a set, and it is the only average that works for non-numerical data like favourite colours. The scores 60, 70, 70, 80 and 90 have the mode 70, because 70 appears twice while every other score appears once. A set can have two modes: the scores 60, 60, 70, 80 and 80 have two modes, 60 and 80, because both appear twice, and such a set is called bimodal. A set can also have no mode: the scores 60, 70, 80, 90 and 100 all appear once, so no value is most frequent. The mode is quick to find from a tally table, where the tallest tally column marks the mode at a glance, and it never needs division, which makes it the simplest average to calculate.
The mode is the right average when the question is about popularity or the most common choice. A shoe shop deciding which size to stock most of checks the mode of sizes sold, not the mean size, because a mean size of 6.5 might correspond to no shoe anyone wears. A teacher asking which question most pupils got wrong looks at the mode of the wrong answers. The mode's weakness is that it may ignore most of the data: in the set 70, 70, 70, 90, 95 and 100, the mode is 70, but the mean is 82.5, which better reflects the higher scores. Choosing between mean, median and mode means asking what the average is for, and the next section gives a simple guide to that choice. The [home page](/) has more study help.
Which Average Should You Use?
Choosing the right average depends on the data and the question, and examiners often ask you to justify your choice. Use the mean when every value matters and there are no extreme outliers, such as ordinary test scores in a class, because the mean uses all the data. Use the median when an outlier would distort the mean, such as incomes or heights with one extreme value, because the median stays typical. Use the mode when you need the most common value or when the data is not numerical, such as favourite subjects or shoe sizes, because only the mode answers those questions. A strong answer names the average, gives its value, and explains the choice in one sentence, for example: the median is 70, chosen because one very low score would drag the mean down.
Sometimes a question asks for all three averages so that they can be compared, and the comparison itself is informative. For the scores 70, 80, 90, 60 and 100, the mean is 80, the median is 80, and there is no mode, because every score appears once, so the mean and median agree and the data looks balanced. For the scores 60, 70, 70, 80 and 90, the mean is 74, because the total is 370 divided by 5, the median is 70, and the mode is 70, so the mean sits above the median because of the high score of 90. Noticing whether the mean is above or below the median tells you which side the extreme values sit on, which is a useful skill for reading data in later classes.
Averages From Tables
Frequency tables organise data before averaging, and they are worth using whenever values repeat. A table of marks might show that 2 pupils scored 60, 3 pupils scored 70 and 1 pupil scored 80: the total number of pupils is 2 plus 3 plus 1, which is 6, and the total of the marks is 2 times 60 plus 3 times 70 plus 1 times 80, which is 120 plus 210 plus 80, giving 410, so the mean is 410 divided by 6, which is about 68.3. The mode is read straight from the table as the value with the highest frequency, which is 70, because 3 pupils scored it. The median needs the ordered list, which the table lets you rebuild: 60, 60, 70, 70, 70, 80, whose two middle values are both 70, so the median is 70.
Tally tables are the first step when raw data arrives as a list, because they turn counting into a table. Suppose the heights in centimetres are 130, 140, 130, 150, 140, 130 and 140: tallying gives 130 three times, 140 three times and 150 once, so the mode is shared between 130 and 140, the total is 3 times 130 plus 3 times 140 plus 1 times 150, which is 390 plus 420 plus 150, giving 960, and dividing by 7 pupils gives a mean of about 137.1 cm. Always check that your frequencies add to the number of data values, or your total will be wrong before you even divide. Tables also make checking easy: a classmate can recount your tallies and confirm your frequencies without redoing the whole calculation. See the solved notes for more practice.
AI Help: Muse AI
Muse AI is Meta's personal AI assistant. You can ask it to explain a concept in simple words, summarise a lesson, or make practice questions for revision.
For this topic, ask Muse AI to explain the difference between mean, median and mode in one short paragraph each, then give you a set of five marks to find all three averages for.
Join Muse with invite code LTGSWD — in the Muse app, go to Settings > Redeem token and enter the code.
Disclosure: LTGSWD is the author's Muse invite code.
Muse AI does not give official STBB answers — always verify against your Sindh Textbook Board book and your teacher.
5 key points you must know
- Mean = total divided by count: 70, 80, 90, 60 and 100 give a mean of 80.
- Median = middle value in order: 55, 60, 70, 80 and 95 give a median of 70.
- Mode = most frequent value: in 60, 70, 70, 80 and 90, the mode is 70.
- With an even count, the median is the mean of the two middle values: 60, 70, 80, 90 give 75.
- Use the mean for balanced data, the median when outliers distort, and the mode for popularity.
Frequently asked questions
How do I find the mean of 70, 80, 90, 60 and 100?
Add them to get 400, then divide by 5, the number of values, giving a mean of 80.
How do I find the median of 60, 70, 80 and 90?
They are already in order, and with an even count there are two middle values, 70 and 80. Their mean is 75, so the median is 75.
What is the mode of 60, 70, 70, 80 and 90?
It is 70, because 70 appears twice while every other value appears once.
Can a set of numbers have no mode?
Yes. If every value appears the same number of times, such as 60, 70, 80, 90 and 100, there is no most frequent value and therefore no mode.
Why use the median instead of the mean sometimes?
Because one extreme value pulls the mean away from the typical value, while the median stays in the middle. For incomes 1,000, 1,200, 1,300, 1,500 and 20,000, the median 1,300 is far more typical than the mean 5,000.
Solved notes — preview free
These guides work best with the solved exercises. Preview the solved notes free on this website — 119 solved notes for Classes 6–10 in Sindhi, Urdu, English and Arabic medium. Or browse the full solved notes catalogue for your class and medium. New solved notes are added regularly — check the catalogue for coming-soon books.