Benazirabad 9th Class Science Result 2026: What the 79.02% Pass Rate Really Means

The Shaheed Benazirabad Class IX Science Group result for 2026 came with a headline figure that is easy to quote and easy to misunderstand: 79.02 percent. Behind that percentage sit three verified counts from the 31 October 2026 announcement — 52,260 students registered, 51,546 students appeared, and 41,425 students successful — and each of those numbers tells a different part of the story. This guide explains what the pass rate really means, what it does not mean, and how students, parents, and teachers should read it without turning a board statistic into a personal judgement. The General Group result was also announced on the same day, with a 52 percent overall pass rate reported, but only that percentage was reported, so this guide treats the General Group figure with the caution it deserves. For background on solved study material, students can explore [solved notes](/solved.html) alongside their own result. A pass rate is a useful summary of a whole cohort, but it is a poor description of any single student, and understanding that difference is the point of this article.
The Verified Science Figures, Step by Step
Start with the three counts, because the percentage only makes sense when you know what it divides. Of the 52,260 Science Group students who registered, 51,546 appeared for the examination, which means 714 registered students did not appear. Of those who appeared, 41,425 were successful, and the remaining 10,121 did not pass all that was required in this annual result. The reported overall pass percentage of 79.02 percent is best understood as successful students measured against appeared students, which is the usual way such a figure is read, and the arithmetic is close to that reading. What matters for students is not the exact decimal, but the shape: roughly four out of five appeared students passed, while roughly one out of five did not, and that one in five represents real students who now need a clear next step, not a statistic to be ignored.
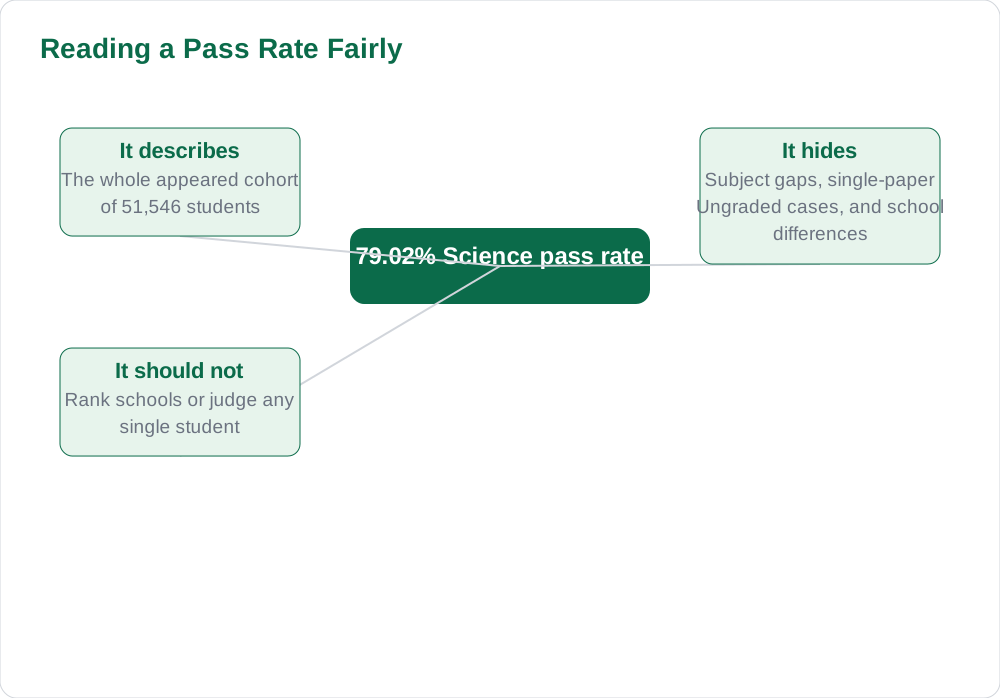
It is also worth noticing what the figures do not say. They do not say how many students passed with high marks, how many passed narrowly, or how many were Ungraded in only one paper versus several papers, because those breakdowns were not in the verified report. They do not say anything about individual schools, individual teachers, or individual students, and they should not be used to rank schools or to shame a class. A board-level pass rate is a cohort summary, and like any summary, it hides variation inside the cohort. Students who passed should still check their own paper profile, and students who did not pass should still focus on their own papers, because the cohort figure cannot tell either group what to study next.
- Registered: 52,260 Science Group students.
- Appeared: 51,546 students, so 714 registered students did not appear.
- Successful: 41,425 students, giving the reported 79.02 percent pass rate.
What a Pass Rate Does Mean
A pass rate does mean something useful at the system level. It tells the board, schools, and the public roughly how the cohort performed as a whole, and it allows a fair comparison with the same board and same group in another year, provided the comparison is made carefully. If a future Science Group pass rate rises or falls sharply, that change is worth asking about, because it may reflect changes in preparation, paper difficulty, marking, or grading rules such as the new 40 percent Ungraded threshold. The 79.02 percent figure also gives context to individual students: a student who passed is part of a large majority, and a student who did not pass is not alone, because more than ten thousand appeared students share that position. That context can reduce isolation, even though it cannot replace personal study.
A pass rate also helps teachers plan. If roughly one in five students did not pass, schools can expect a meaningful number of students to need support in specific subjects, and they can plan revision, re-study, and guidance accordingly. Parents can use the figure to ask better questions, such as which subjects produced the most Ungraded results in their child's school, rather than asking only whether the school is good or bad. Used this way, a pass rate becomes a planning tool, not a trophy or a punishment. The books page offers a starting point for students who want to revisit the subjects behind the numbers.
What a Pass Rate Does Not Mean
A pass rate does not mean that the examination was easy or difficult, because difficulty cannot be read from a single percentage without knowing the papers, the marking, and the cohort. It does not mean that every passing student understands every topic deeply, because a pass threshold is a minimum standard, not a measure of mastery. It also does not mean that a student who did not pass is weak in every subject, because many students miss the threshold in one paper while passing the rest, and the new Ungraded rule makes that paper-by-paper picture especially important. Treating the whole cohort figure as a personal grade is therefore a mistake in both directions: it flatters some passing students into complacency and unfairly labels some struggling students as failures.
The figure also does not allow a fair comparison between groups of different sizes or different subjects without care. Science and General Groups have different papers, different cohorts, and different histories, so a direct comparison of their percentages without that context would mislead. Even within the Science Group, the headline figure hides differences between subjects, between schools, and between boys and girls if such breakdowns exist but were not reported. The honest use of 79.02 percent is to describe the Science cohort as a whole on this occasion, and no more. Students should judge themselves by their own paper results and their own understanding, not by a board average.
The General Group 52 Percent: Read With Caution
The General Group result was reported with a 52 percent overall pass rate, but the verified report did not include the registered, appeared, or successful counts for that group. That absence matters, because without the underlying counts, readers cannot tell whether the General Group was large or small, how many students did not appear, or how many students were successful in absolute terms. The snapshot itself warns that the General Group is a small cohort and that its counts should not be invented, so this guide repeats that warning clearly. A 52 percent rate in a small cohort can move sharply from year to year with only a small change in student numbers, while the same percentage in a large cohort would be far more stable. Readers should therefore treat the General Group figure as a reported percentage only, not as a full statistical picture.
For General Group students, the practical message is the same as for Science students: read your own papers, not the group average. If you passed, strengthen your weakest subject for the next class; if a paper is Ungraded, focus on that paper and follow the board's own notice for the next step. Parents should avoid comparing a General Group percentage directly with the Science Group percentage as if the two groups sat the same papers under the same conditions, because they did not. The value of reporting both figures together is that families can see that both groups had results on 31 October 2026, not that one group is simply better than the other. General study guidance is available through study guides for students planning their next year.
How Students Should Use This Result Season
Whether you are in the 79.02 percent who passed in Science, the 52 percent reported for General, or the group that still needs to clear a paper, the useful response is the same: turn the result into a study list. Write down your passed papers, your Ungraded papers, and the topics within each Ungraded paper that need the most work, then build a short daily routine around that list. Ask teachers which Class IX topics will matter most in Class X, because strengthening those foundations now pays off twice, once for clearing the paper and once for the next class. Keep the board's official channels as your source for procedures, and keep your own result copy safe for future forms. A result season is a good time to reset habits, not to make permanent judgements about ability.
Parents and teachers can help by keeping the conversation focused on papers and topics rather than on percentages and comparisons. Praise effort and specific improvement, name the exact next step for any Ungraded paper, and avoid repeating the headline percentage as if it explains a child's result. Students who feel supported after a difficult result are far more likely to return to study quickly, while students who feel judged are more likely to withdraw. The 79.02 percent figure will soon be replaced by next year's figure, but the study habits formed in November 2026 will still matter in Class X. That is the real lesson behind the number, and it belongs to every student, not only to the majority who passed.
AI Help: Muse AI
Muse AI is Meta's personal AI assistant, and it can help you understand board statistics without doing your studying for you. For example, you can ask it to explain in simple words what a pass rate means and why a group percentage should not be compared directly with another group. Join Muse with invite code LTGSWD — in the Muse app, go to Settings > Redeem token and enter the code. Disclosure: LTGSWD is the author's Muse invite code. Muse AI does not give official STBB answers — always verify against your STBB book and your teacher. Always verify against your Sindh Textbook Board book and your teacher before using anything in classwork.
5 key points you must know
- Science Group: 52,260 registered, 51,546 appeared, 41,425 successful, 79.02 percent pass rate.
- About 714 registered Science students did not appear, and about 10,121 appeared students were not successful.
- A pass rate describes a whole cohort, not any single student's understanding or effort.
- General Group: only the 52 percent rate was reported, so its registered and appeared counts must not be invented.
- Students should judge themselves by their own paper results and follow the board's notice for next steps.
Frequently asked questions
What were the verified Benazirabad Science Group figures for Class IX 2026?
The announcement on 31 October 2026 reported 52,260 registered, 51,546 appeared, and 41,425 successful students in the Science Group, with an overall pass percentage of 79.02 percent.
Why did 714 registered students not count in the appeared figure?
The difference between registered and appeared students is the number who registered but did not sit the examination. The pass rate is normally read against appeared students, which is why the appeared figure matters.
What do we actually know about the General Group result?
Only that a 52 percent overall pass rate was reported. The verified report did not give registered, appeared, or successful counts for the General Group, so those numbers should not be invented or guessed.
Does a 79.02 percent pass rate mean the exam was easy?
No. A single pass rate cannot prove that an exam was easy or difficult, because it does not show paper difficulty, marking, or the cohort's preparation. It only summarises how the whole cohort performed.
How should a student use the pass rate?
Use it for context only. Focus on your own paper results, identify any Ungraded papers, and build a study plan around those papers while following the board's own notice for official procedures.
Solved notes — preview free
These guides work best with the solved exercises. Preview the solved notes free on this website — 119 solved notes for Classes 6–10 in Sindhi, Urdu, English and Arabic medium. Or browse the full solved notes catalogue for your class and medium. New solved notes are added regularly — check the catalogue for coming-soon books.